
IT Infrastructure Operations Platform
One command center to monitor, manage and run your entire IT infrastructure.
Monitor infrastructure in real time with Network Pulse, convert alerts into accountable incidents, assign the right engineer, control SLAs, and manage assets, spares and reporting — from one platform.
- Network Pulse
- Incident Operations
- Asset Lifecycle
- SLA & Engineer Routing
- Inventory
- Operations Wallboard
Built for internal IT infrastructure teams · Made in India for global operations
241 online · 5 warning · 2 offline
Incident created · Engineer assigned · SLA running
Interactive — try it right here
See how InfraCue turns an infrastructure issue into a resolved incident.
Simulate a monitored device failing
Pick a sample device and condition, then watch the full operational response.
Interactive demonstration using fictional data. No device is actually scanned, monitored, or contacted.
Raise a sample employee ticket
Choose the details and watch routing, SLA and asset context attach automatically.
Interactive demonstration with fictional data. Nothing is saved or submitted.
- Condition detectedChoose a device and condition, then run the simulation
- Alert generatedSeverity evaluated
- Incident createdStructured incident with signal context
- Device & asset linkedAsset record and history attached
- Location identifiedBranch context applied
- Engineer assignedRouting rules pick the right person
- SLA startedTargets applied automatically
- Wallboard updatedThe room sees it instantly
Network Pulse identified the issue and InfraCue initiated the response.
The problem
Your infrastructure operation should not live across seven disconnected tools.
When monitoring, tickets, assets, engineers, inventory and SLA live in separate systems, every incident begins with missing context.
Disconnected operation
Eight places to look before anyone can act.
Every incident starts with reconstruction: which device, whose asset, which branch, who is free, how long do we have?
The InfraCue command center
One workflow where every signal keeps its context.
Command Center
Monitoring feeds incidents, incidents carry assets and locations, assignment knows workload, SLA is visible, resolution updates analytics.
Connected operations workflow
From alert to resolution, every step stays connected.
Network Pulse Trial included
See the health of your infrastructure before it affects the business.
Network Pulse continuously reflects the availability and operational condition of the devices you choose to report — servers, switches, routers, firewalls, access points, UPS systems, printers and other IP-connected infrastructure. When a critical condition arrives, InfraCue keeps it connected to the relevant location, asset record, engineers and SLA workflow.
| Device | Host | Location | Last seen | State |
|---|---|---|---|---|
| Core Switch 01Switch | 10.0.0.10 | Mumbai · BKC | 14s ago | ONLINE |
| Branch Router BLRRouter | 10.4.0.1 | Bengaluru | 22s ago | ONLINE |
| App Server 02Server | app-02.local | Mumbai · BKC | 31s ago | DEGRADED |
| UPS BasementUPS | 10.0.9.4 | Pune | 48s ago | ONLINE |
| WiFi AP Floor 3Access point | 10.0.3.7 | Delhi · Saket | 2m ago | OFFLINE |
- CRITICALWiFi AP Floor 3 offlineDelhi · Saket — 2m ago · linked to asset NIC-2024-01009
- WARNINGApp Server 02 degradedMumbai · BKC — 31s ago · reported by collector
- RECOVEREDBranch Router BLR back onlineBengaluru — 18m ago · downtime recorded
Illustrative interface with fictional sample data.
From network signal to accountable response
Generic ticketing waits for someone to complain. Network Pulse lets the infrastructure speak first — and InfraCue keeps the response accountable.
- Device condition detected
- Alert severity evaluated
- Incident created with device & location context
- Engineer assigned, SLA running
- Downtime recorded, recurring failures analysed
What Network Pulse watches: the devices you approve — via the outbound-only InfraCue Collector or events forwarded from Zabbix, PRTG, SolarWinds, Nagios, ManageEngine or any signed webhook source. InfraCue never scans your network and never stores your monitoring vendor's credentials.
The platform
Six modules. One operational spine.
Every module reads and writes the same records — so context never has to be copied between tools.
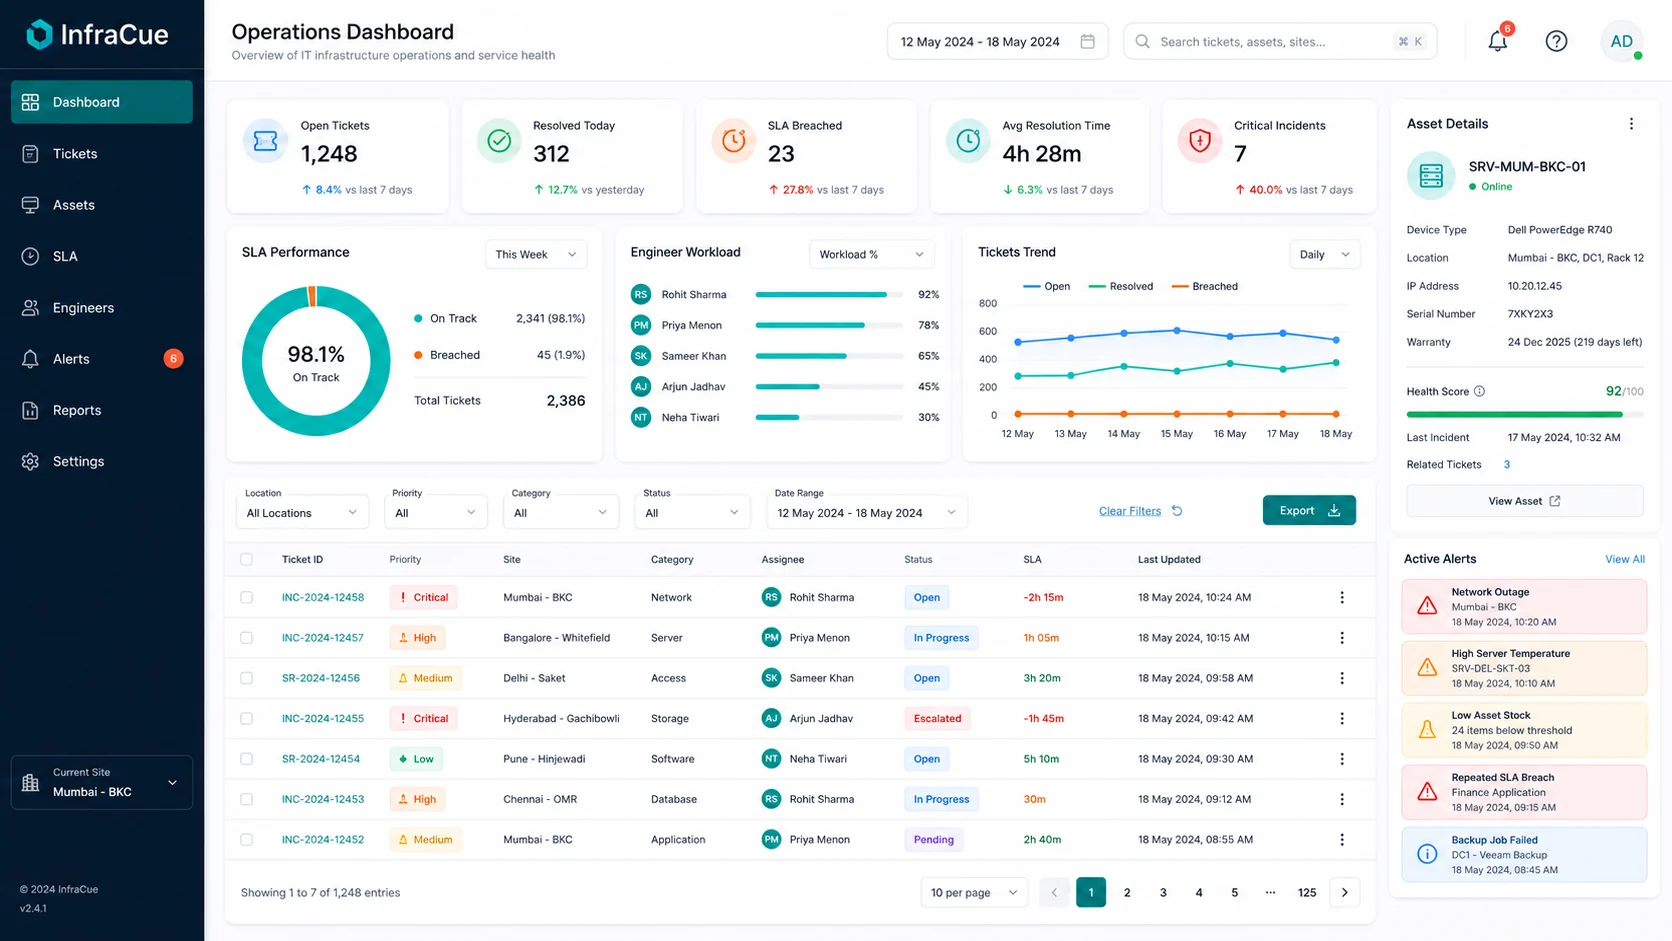
Network Pulse — real-time device health Trial included
See the availability and operational condition of network and infrastructure devices beside your tickets, SLA and wallboard — from the InfraCue Collector or the monitoring platform you already run.
- Device states — up, degraded, down, maintenance — in one view
- Signed, outbound-only ingestion: InfraCue never scans your network
- Works with Zabbix, PRTG, SolarWinds, Nagios, ManageEngine or any signed webhook
- Device health surfaces directly on the operations wallboard
Incident operations without the inbox chaos
Capture incidents from employees or detected signals, route them automatically by category and location, handle exceptions with manual dispatch, and keep a complete audit trail.
- Automatic assignment rules plus manual dispatch for exceptions
- Reassignment requests with an audit trail
- Priority, category, sub-category and location on every ticket
- Full status history on every state change
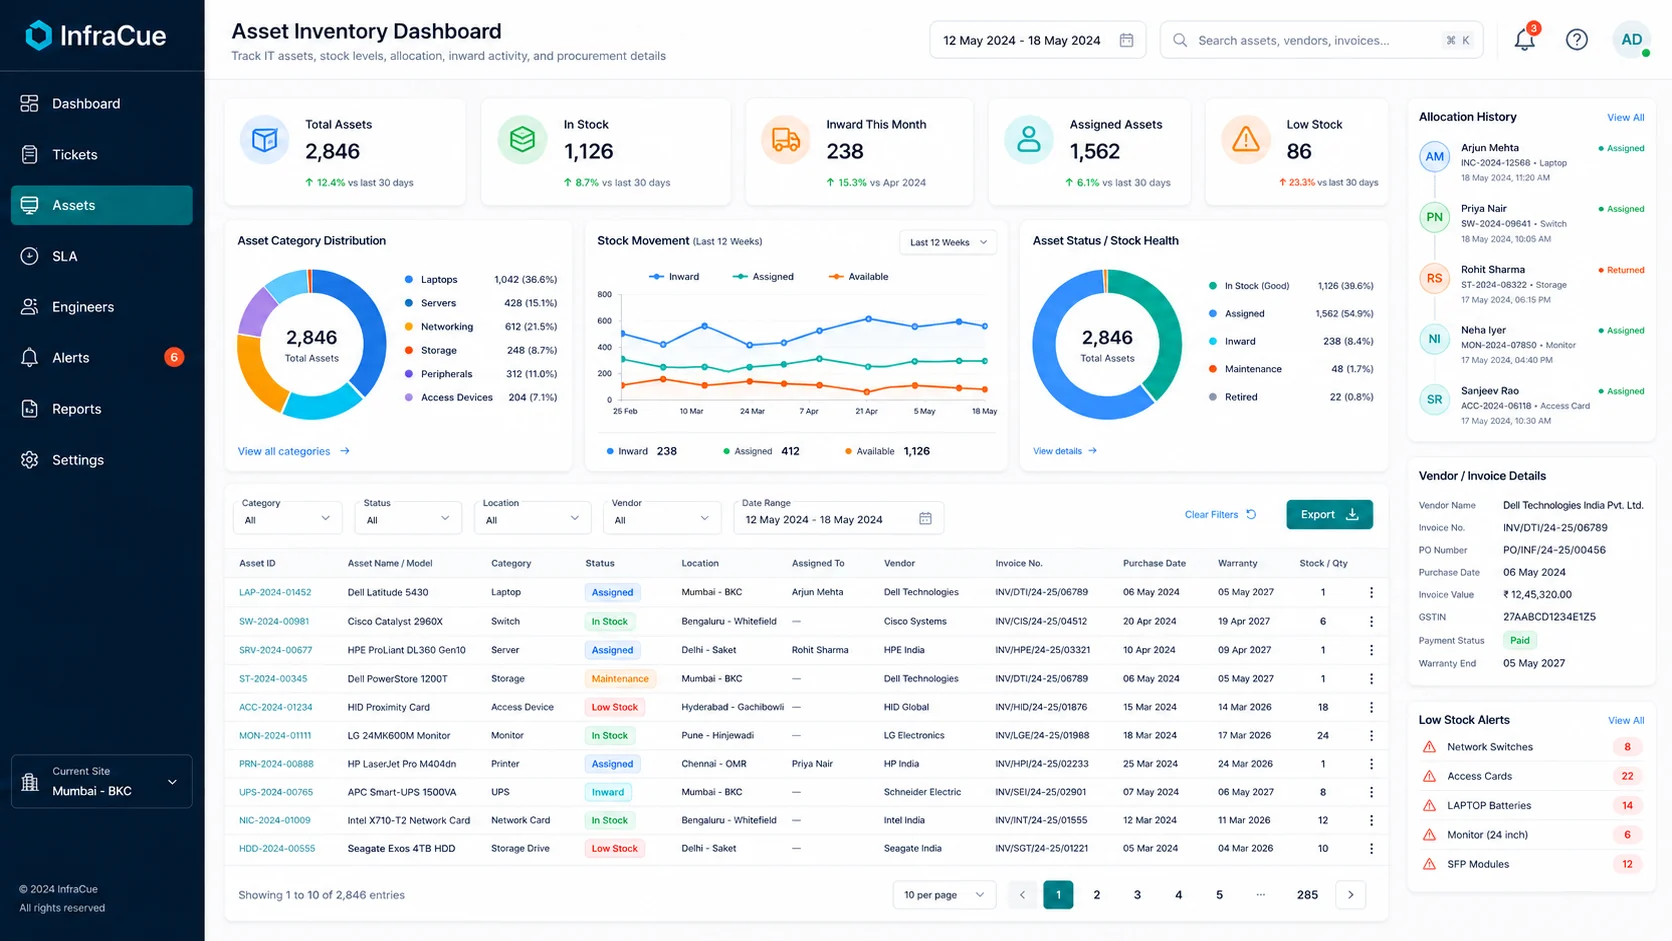
Every asset, every handover, one record
Track inward entry, stock, allocation, warranty, AMC, movement, ownership and handovers — and see the linked asset context on every incident.
- Allocation and handover history per asset
- Warranty and AMC dates tracked with the record
- Vendor and invoice details beside the asset
- Low-stock alerts before spares run out
Workload balanced, SLA visible before breach
Balance engineer workload, control priorities, track SLA timers with paused states, and expose breach risk early enough to act on it.
- SLA targets by priority and sub-category
- Paused and waiting states that stop the clock fairly
- Per-engineer workload visibility
- Breach risk surfaced before it becomes a breach
Spares ready before the incident needs them
Track available stock, minimum thresholds, inward movement and consumption — so an incident never stalls because the spare was not there.
- Minimum-stock thresholds with alerts
- Inward movement and consumption tracking
- Stock health beside asset categories
- Replenishment needs visible at a glance
The right operational view for every role
Engineers see their queue, managers see risk and workload, leadership sees trends — and the IT-room TV shows the live wallboard.
- Workload, breach and category-pressure reports
- Filtered, charted and exportable views
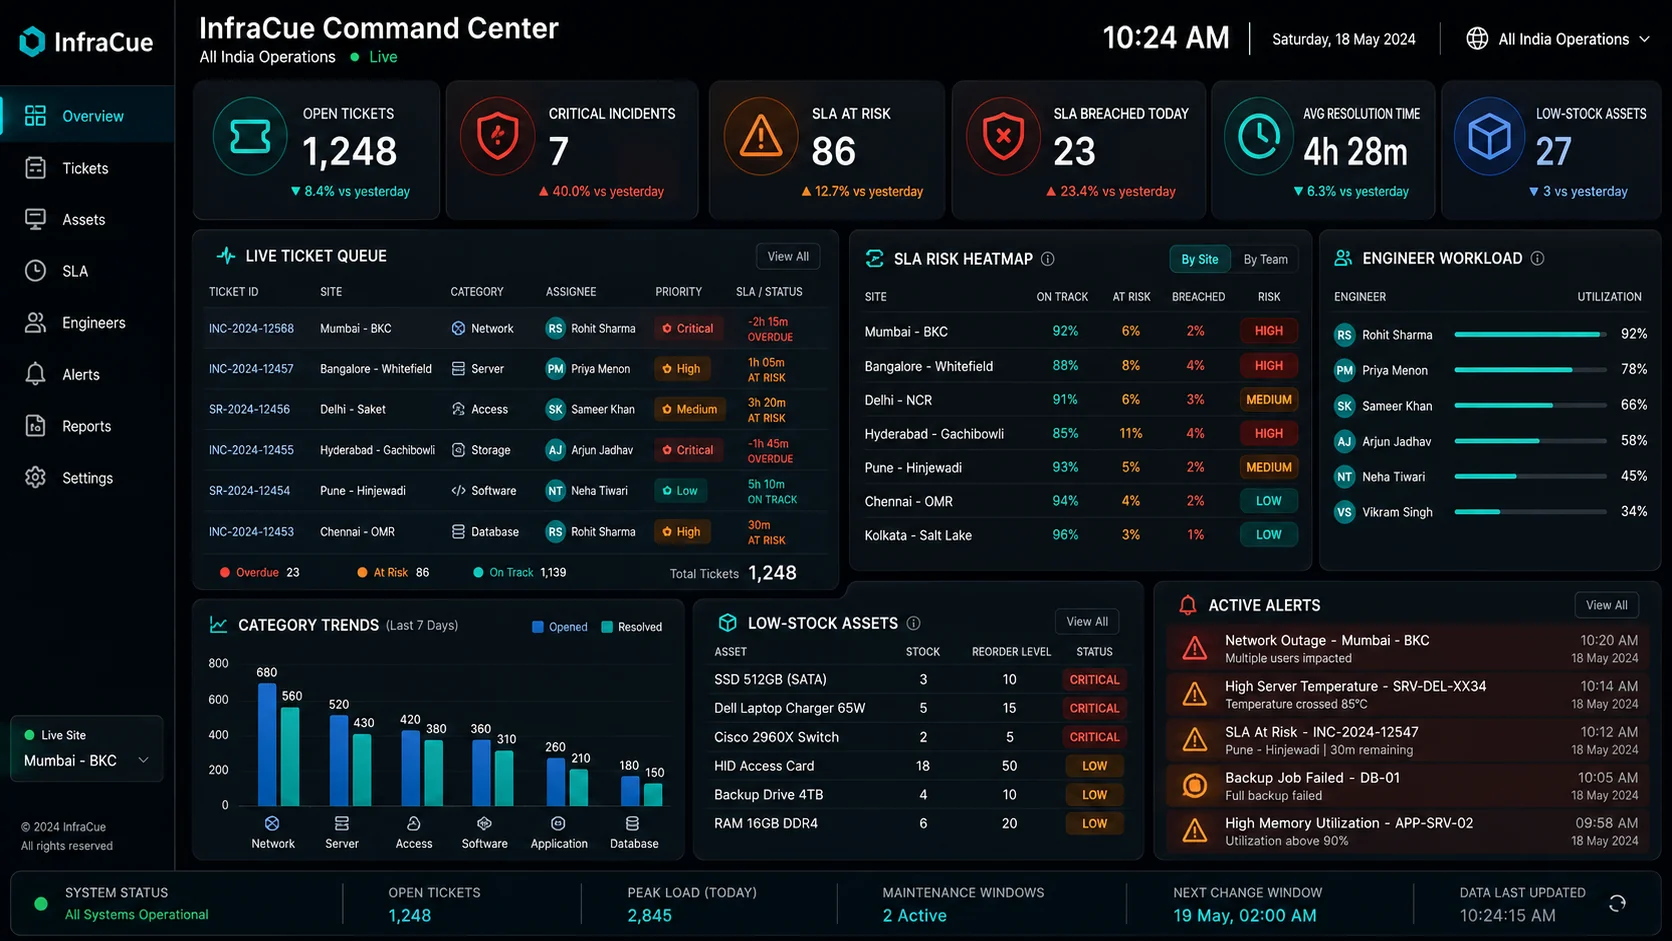
- Dark 16:9 wallboard built for TV screens
- Auto-refreshing, read-only display mode

- Signal
- Core Switch Offline
- Location
- Mumbai Office
- Engineer
- Assigned
- SLA
- Running · 41m
- Asset
- SW-2024-00981
Built for the people doing the work
Network Pulse finds the signal. Your team gets the context.
Every assignment arrives with the requester or the detecting signal, location, priority, linked asset, previous incidents, SLA clock and full activity history. Engineers spend less time reconstructing the problem and more time resolving it.
- My Queue sorted by urgency and SLA
- Asset and location context attached
- Reassignment requests with an audit trail
- Raise issues on behalf of employees
- Complete incident and handover history
- Clear waiting and paused states
Operations wallboard
Turn any IT-room screen into a live operations wallboard.
Critical incidents, SLA risk, engineer workload, device health, location status and inventory alerts — auto-refreshing on a read-only display account. No sidebar, no scrolling, designed for TV screens.
LIVE
- Critical incidents
- SLA risk
- Engineer workload
- Device health
- Location status
- Inventory alerts
- Read-only · auto-refresh
Role-based visibility
Everyone sees their operation. Nobody digs for it.
The operation, summarised honestly
Trends and risk without asking anyone to compile a report.
- Downtime and breach trends
- SLA performance over time
- Branch and location health
- Asset and warranty risk
- Operational pressure by category
Today’s risk, before it lands
The live queue, engineer load and what is about to breach.
- Incident queue with priorities
- Engineer workload balance
- Breach risk before it happens
- Critical device states
- Inventory alerts
Context, not another queue to manage
Every assignment arrives with the story attached.
- My Queue sorted by urgency and SLA
- Asset and location context attached
- SLA timer with paused states
- Full activity history
- Reassignment with an audit trail
The register that maintains itself
Lifecycle, movement and paperwork in one record.
- Stock and minimum thresholds
- Inward movement tracking
- Allocation and handovers
- Warranty and AMC dates
- Complete movement history
Report it once, see it progress
No chasing on chat — the ticket shows its own status.
- Raise an issue in seconds
- Select the affected asset
- Track progress live
- Receive updates automatically
- See past requests
Solutions
Designed for infrastructure teams operating in the real world.
Manufacturing
Monitor plant and office devices, route incidents by facility, and track critical assets across locations.
Hospitals & Healthcare
Keep infrastructure availability, engineer response, device ownership and SLA-critical incidents visible.
Educational Institutions
Manage campus networks, laboratories, classrooms, assets and support teams from one system.
Corporate Offices
Run structured IT support for employees with SLA accountability and clean asset records.
Retail & Multi-branch
Route branch incidents to the right engineers and keep per-location health visible centrally.
Logistics & Warehouses
Keep scanners, printers, networks and dock infrastructure operational across sites.
IT & Technology Companies
Give internal IT the same operational rigour your product teams expect from their own tooling.
Security & deployment
Operational visibility without compromising control.
Pricing
Every plan starts with the full-product 30-day trial.
Starter
Small IT teams starting with structured tickets and assets
₹2,999/month
30-day free trial · no credit card
- 75 employee accounts
- 3 IT/Admin seats
- 2 locations
- 300 tickets per month
Growth
Growing teams managing multiple departments and locations
₹6,999/month
30-day free trial · no credit card
- 300 employee accounts
- 10 IT/Admin seats
- 5 locations
- Auto + manual assignment
Scale
Larger internal IT teams needing stronger operational control
₹12,999/month
30-day free trial · no credit card
- 1,000 employee accounts
- 25 IT/Admin seats
- TV wallboard + Network Pulse monitoring
- Advanced reports + API access
Employee accounts vs IT/Admin seats: employee accounts let staff raise and track their own tickets; IT/Admin seats are for the engineers and managers running the operation. Every regular plan includes the full product during its 30-day trial. After conversion, Wallboard is included in Growth and Scale, while Network Pulse is included in Scale. Starter and Growth receive a one-time 15-day Network Pulse introduction after paid activation.
Need dedicated infrastructure, custom limits, custom workflows, integrations, or deployment support?
Transparent proof
Test InfraCue against your own operation.
No invented testimonials, no fake logos. Use the trial to answer the questions that actually matter:
Can the right engineer receive the right issue automatically?
Can managers see SLA risk before a breach?
Can every asset retain its allocation and handover history?
Can an infrastructure alert become an operational incident?
Can the wallboard expose critical workload without manual reporting?
Can stock alerts prevent unavailable spares during an incident?
Use your real locations, real team structure and real workflow during the trial. Continue only when InfraCue proves it makes the operation clearer. Your review could be the first verified customer story published here.
FAQ
Fair questions, straight answers.
Is the trial really the full product?
Yes. Tickets, SLA, routing, assets, reports, the TV Wallboard and Network Pulse are available during the 30-day trial across every regular plan. No credit card, and nothing to cancel — if it is not for you, just stop using it.
What is Network Pulse?
Network Pulse is InfraCue’s real-time device health capability. It shows the availability and condition of network and infrastructure devices — up, degraded, down or maintenance — beside your tickets, SLA and wallboard, so detection and response live in the same platform.
How does Network Pulse detect device issues?
It is event-based, not scan-based. A lightweight outbound-only InfraCue Collector (Linux and Windows scripts) or your existing monitoring platform — Zabbix, PRTG, SolarWinds, Nagios, ManageEngine, or any tool that can send a signed webhook — forwards device status events to a signed InfraCue endpoint. InfraCue never probes your network directly and never stores your monitoring vendor’s credentials.
Can Network Pulse automatically create incidents?
Network Pulse surfaces device states and event history beside tickets and on the wallboard. Incident creation and routing follow the configured workflow, so your team can decide which signals should become accountable work.
Is Network Pulse included in the free trial?
Yes. Every regular plan can explore Network Pulse during the 30-day trial. After conversion, it remains included on Scale; Starter and Growth receive a one-time 15-day introduction so teams can experience the capability before deciding whether to upgrade.
Does Network Pulse require an agent on every device?
No. The collector is a small outbound-only script that reports on the devices you approve, or your existing monitoring platform forwards events. Nothing inbound is exposed, and InfraCue cannot execute commands on your network.
Can automatic and manual assignment work together?
Yes. Rules route routine tickets automatically while authorized dispatchers handle exceptions and rebalance workload by hand.
Can InfraCue support multiple locations?
Yes. Locations are first-class: tickets route by location, assets belong to locations, and dashboards can be filtered per branch. Plan limits define how many locations are included.
How are assets linked with tickets?
Each ticket can reference the affected asset, so the engineer sees the model, location, allocation history, warranty and previous incidents beside the request. Monitored Network Pulse devices can also be connected to their asset records when configured.
How does SLA pausing work?
SLA targets apply by priority and sub-category, and waiting or paused states stop the clock fairly — for example while a part is on order — with the full history recorded.
What deployment options are available?
Shared database by default, dedicated database for regulated teams, and custom or on-premise deployment on Custom plans.
What security controls are included?
Tenant isolation, email OTP sign-in, role-based permissions, audit logs on every state change, validated uploads, and HMAC-signed monitoring ingestion for Network Pulse.

Your infrastructure operation could be running from one command center.
Set up your real locations, team, assets and workflow. Use the complete platform for 30 days and decide using your own operational results.
No credit card · Full product access · Guided setup available