
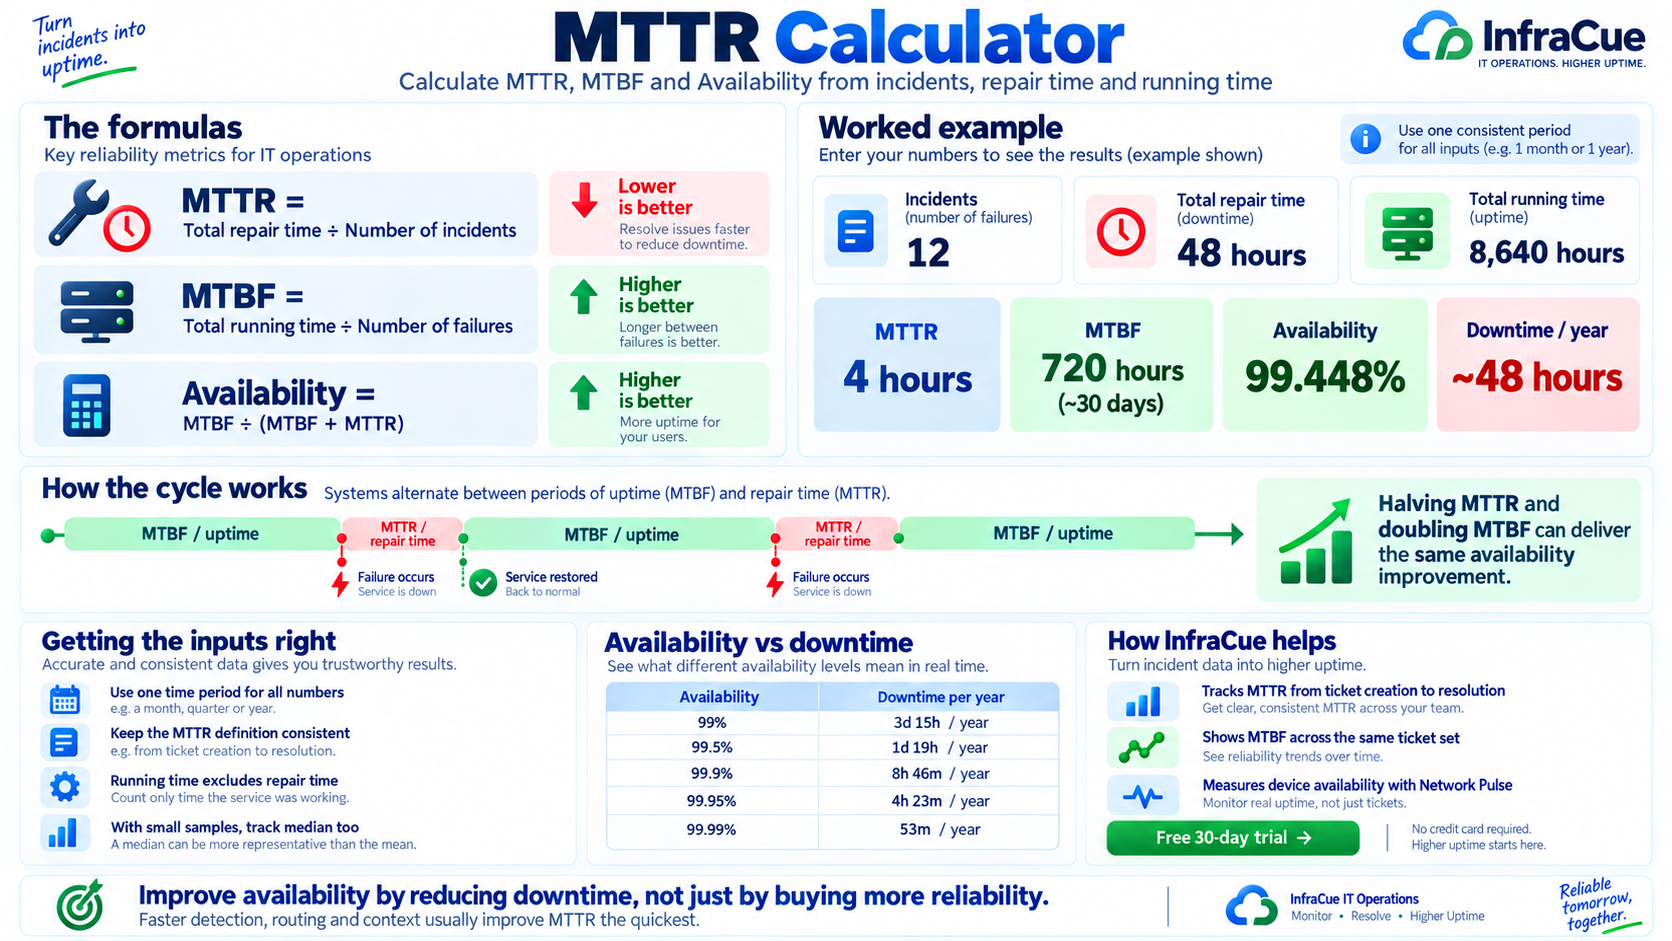
Work out what an uptime target actually costs in downtime — and whether the number you have promised is one your team can keep. Enter incidents, repair time and running time to get availability, downtime per year, MTTR and MTBF.
Uptime & availability calculator
Use one consistent period — a month, a quarter, a year — for all three inputs. Everything recalculates as you type.
Availability here is the modelled figure from MTBF and MTTR. It answers “what should this estate deliver on average”, which is not the same question as “what did it actually deliver” — see the note further down.
Choosing an Uptime Target You Can Actually Hit
Nines are easy to promise and expensive to keep. Each step up is roughly ten times less downtime, and the engineering needed does not scale politely alongside it.
- 99% — nearly four days a year. Honest for internal tools nobody depends on hourly, and for a small team with no out-of-hours cover.
- 99.5% — under two days. Realistic for a business-hours IT team with a clear escalation path.
- 99.9% — under nine hours. Needs monitoring that pages someone, and someone who answers outside office hours.
- 99.95% and beyond — four hours or less. Redundancy, failover tested in anger, and staffing that does not rest on one person’s phone.
The common mistake is committing to a figure that describes the ambition rather than the rota. A target nobody staffs for produces breach reports everyone learns to ignore, which is worse than a lower number people believe.
One practical check: a 99.9% promise from a team covering 45 hours a week is a promise about the other 123 hours too. If nothing watches overnight, the target is being carried by luck.
Where the Inputs Come From
Three numbers over one consistent period — a month, a quarter or a year. Incidents is how many times service was lost. Repair time is the total from failure to restoration, added up. Running time is the time the system was up, excluding repair.
Two rules keep the output meaningful: use the same period for all three, and keep the definition of repair time consistent between incidents — from detection, or from ticket creation, but not a mix of both. If you want the derivation rather than the result, the MTTR formula worked step by step covers it properly.
What Availability Actually Promises
| Availability | Downtime / year | Downtime / month |
|---|---|---|
| 99% | 3d 15h | 7h 18m |
| 99.5% | 1d 19h | 3h 39m |
| 99.9% | 8h 46m | 43m |
| 99.95% | 4h 23m | 21m |
| 99.99% | 53m | 4m |
How InfraCue Reports These
If you would rather not maintain this in a spreadsheet, InfraCue reports both metrics from your ticket data directly:
- MTTR. The tile reads MTTR · 30 Days and shows mean wall-clock time from ticket creation to resolution, on a rolling 30 days against the previous 30, with the ticket count behind the mean. Workspace-wide on the admin dashboard, per-engineer on the infra dashboard.
- MTBF. Mean time between one ticket being raised and the next, over exactly the tickets MTTR measures — same eligibility, same window, same comparison period, so the two cards describe one estate rather than two.
- Measured device availability. Network Pulse polls watched devices and reports availability as successful checks divided by total checks, per device, alongside the outages behind it — the measured figure rather than the modelled one.
InfraCue is free for 30 days — tickets, SLA timers, MTTR, MTBF and per-device availability from your own incidents. No credit card, nothing to cancel.
Start a free 30-day trialCommon Questions
What is a good MTTR?
There is no universal number, because it depends entirely on which two timestamps you measure and what you support. The useful benchmark is your own trend: MTTR falling quarter on quarter with a stable incident count means your response is genuinely improving. A cross-industry figure quoted without its definition is close to meaningless.
How do I calculate MTTR in a spreadsheet?
Add a column for resolution timestamp minus creation timestamp, take the average of that column, and format the result as elapsed time rather than clock time — that last step is where most spreadsheets go wrong, showing 4:00 as four o'clock rather than four hours. Take the median of the same column while you are there.
Does MTTR include time waiting on the requester?
It does unless you deliberately subtract it. Wall-clock MTTR answers “how long was this open”, which is the business-facing question. If you want “how fast does the team work”, you need the SLA clock, which pauses on waiting states. Reading both together shows how much of your MTTR is your team and how much is everyone else.
Can I calculate MTBF without knowing running time?
You can approximate it from incident timestamps alone: sort the failures by date and average the gaps between consecutive ones. That is the interval between failures rather than operating hours divided by failures, so it quietly includes repair time, but on systems with short repairs the two land close together.
Why does my availability look better than it feels?
Usually because the model is being asked a question it cannot answer. A system with 99.9% availability delivered as one 8-hour outage during month-end feels nothing like the same figure delivered as 43 minutes a month. Averages hide distribution, which is why the outage list matters as much as the percentage. See what an SLA breach actually is for how those targets get set and missed.