
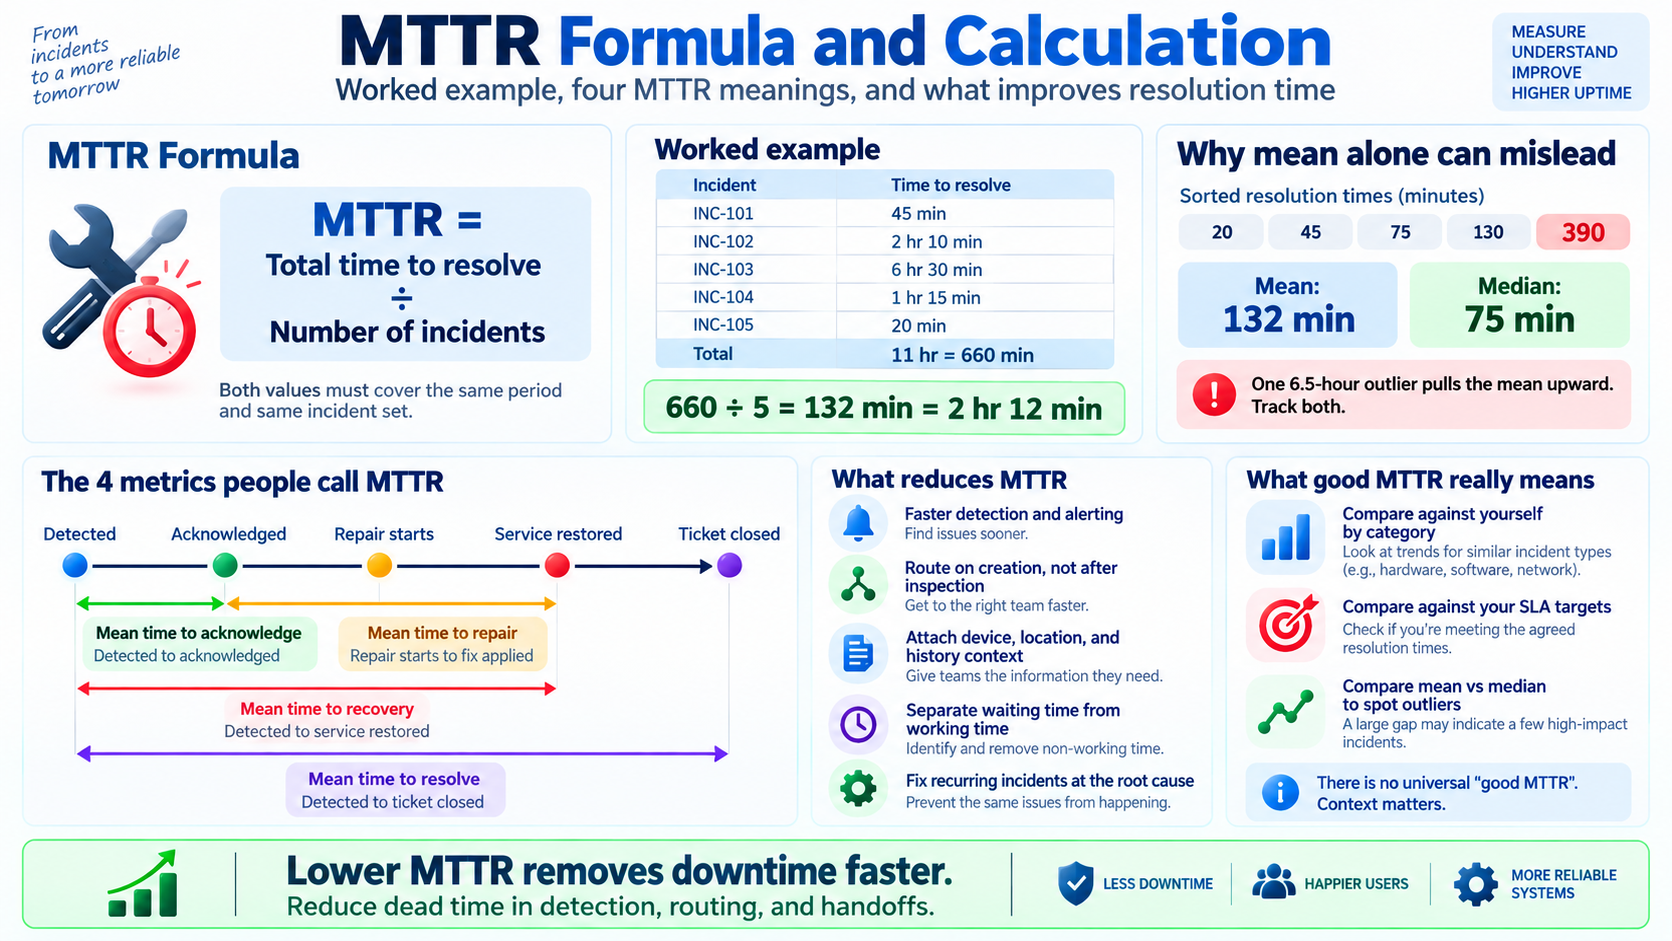
MTTR is the most quoted number in IT operations and one of the most inconsistently defined. Four different metrics share the abbreviation, teams compare figures that measure different things, and the arithmetic mean hides the incidents that actually hurt. Here is the formula, a worked example, and the parts that usually go wrong.
MTTR = total downtime ÷ number of incidents. If five incidents in a month took 45 min, 2 hr 10 min, 6 hr 30 min, 1 hr 15 min and 20 min to resolve, that is 11 hours across 5 incidents, so MTTR = 2 hr 12 min. The complications are which clock you start, which you stop, and whether a mean is the right average at all.
The MTTR Formula
That is the whole calculation. The difficulty is never the division — it is agreeing what "time to resolve" means, and making sure every incident in the numerator is also counted in the denominator.
Worked example
Five incidents closed in a month:
| Incident | Time to resolve | In minutes |
|---|---|---|
| INC-101 | 45 min | 45 |
| INC-102 | 2 hr 10 min | 130 |
| INC-103 | 6 hr 30 min | 390 |
| INC-104 | 1 hr 15 min | 75 |
| INC-105 | 20 min | 20 |
| Total | 11 hr | 660 |
MTTR = 660 ÷ 5 = 132 minutes, or 2 hr 12 min.
The Four Metrics That All Get Called MTTR
This is the single biggest source of confusion, and it is why two teams can both report "MTTR of 2 hours" while measuring completely different things.
| Metric | Clock starts | Clock stops | Question it answers |
|---|---|---|---|
| Mean time to acknowledge | Incident detected | Someone picks it up | Are we watching the queue? |
| Mean time to repair | Work actually starts | Fix is applied | How long does the fix itself take? |
| Mean time to recovery | Incident detected | Service is usable again | How long were users affected? |
| Mean time to resolve | Incident detected | Ticket closed, cause addressed | How long until it was truly finished? |
One incident, four different answers
What Counts as a Good MTTR?
There is no credible universal benchmark, and you should treat any single number quoted as one with suspicion. An MTTR of four hours is excellent for a failed storage array requiring a hardware swap and terrible for a password reset. What a benchmark cannot know is your incident mix.
Three comparisons that are actually informative:
- Against yourself, by category. Network incidents this quarter vs last quarter is a fair comparison. Network vs access requests is not.
- Against your own SLA targets. If your resolution target for High priority is four hours and your MTTR for High is 3 hr 40 min, you are meeting the promise but with almost no margin — one bad week will breach it.
- Mean against median. A widening gap means outliers are growing. That is usually more actionable than the headline figure moving a few minutes.
What Actually Reduces MTTR
Most MTTR improvement comes from removing dead time, not from engineers working faster. In rough order of how much time they typically recover:
- Cut the acknowledge gap. Time between detection and someone picking the incident up is pure dead time, and it is usually the easiest interval to shrink with routing and alerting.
- Route on creation, not on inspection. Every handoff between engineers restarts the context-building. Automatic assignment by category and location removes most of it.
- Attach context to the incident. If the engineer opens the ticket already knowing the device, location, and recent history, they are not spending the first twenty minutes reconstructing the problem.
- Separate "waiting on someone else" from "working". Time spent waiting on a vendor or an approval inflates MTTR without telling you anything about your team. Track it separately or you will chase the wrong fix.
- Fix the recurring incidents. The same failure appearing monthly is a problem-management gap. No amount of faster response makes it go away.
Notice that only the last of these is about the technical fix. If your MTTR is dominated by detection and routing delay, buying faster engineers will not move it. This is the same pattern behind most SLA breaches: the target is missed in the gaps between work, not during it.
Measuring MTTR in InfraCue
InfraCue reports MTTR as a dashboard metric, and it is worth being exact about which two points it measures — because, as above, that is the question that makes any MTTR figure comparable or meaningless.
- It measures creation to resolution. The tile reads MTTR · 30 Days and shows the mean wall-clock time from when a ticket was raised to when it was resolved, formatted like 2h 12m or 3d 4h.
- Rolling 30 days, compared to the 30 before it. Underneath the figure is the direction of travel — ↓ 12% vs previous 30 days — so you are reading a trend rather than a single snapshot, plus the number of tickets the mean is based on.
- Two scopes. The admin dashboard shows it workspace-wide. The engineer dashboard shows the same metric for tickets currently assigned to that engineer.
- Only genuinely finished work counts. A ticket is eligible while its status is Resolved or Closed and its resolution timestamp falls inside the window. Reopening a ticket clears that timestamp, so reopened work drops out until it is resolved again — which stops the metric being flattered by premature closes.
The MTBF card beside it
The dashboards show MTBF next to MTTR, and the two are deliberately built from the same tickets — identical eligibility, the same rolling 30 days, the same preceding period to compare against. The ticket count printed under both cards is the same number, for exactly that reason.
What differs is which pair of timestamps gets measured. MTTR spaces creation to resolution: how long a ticket took to clear. MTBF spaces creation to creation: how long passed between one ticket arriving and the next. The direction of good inverts too — a rising MTBF is an improvement, so its arrow points the opposite way to the card sitting beside it. One consequence worth knowing: a period needs at least two tickets before there is a gap to measure at all, so a very quiet month can show a valid MTTR and no MTBF.
What the dashboard tile does not give you is the median, or a split by priority, category or location. For those, the ticket report still exports Created, First Response and Resolved to CSV alongside the SLA state, which is enough to calculate median resolution time and mean time to acknowledge in a spreadsheet.
InfraCue is free for 30 days with your real tickets, priorities and targets. No credit card, nothing to cancel.
Start a free 30-day trialCommon Questions
What does MTTR stand for?
Depending on who is using it: mean time to repair, mean time to recovery, mean time to resolve, or occasionally mean time to respond. They measure different intervals of the same incident, so the expansion matters. Always ask which one a figure refers to.
What is the difference between MTTR and MTBF?
MTTR measures how long you take to fix things; MTBF — mean time between failures — measures how long things run before breaking. MTTR is about response capability, MTBF about reliability. Together they give you availability: uptime improves either by failing less often or by recovering faster. The two metrics compared in full, including where MTTF fits.
Should MTTR include time waiting on the requester or a vendor?
For an internal team metric, no — you cannot be accountable for time you do not control, and including it makes the number reflect your suppliers rather than your team. For a business-facing "how long were we affected" figure, yes, because the user was still waiting. This is exactly why you should keep time-to-repair and time-to-recovery as separate numbers.
Is a lower MTTR always better?
Not unconditionally. MTTR can be driven down by closing tickets prematurely, by classifying incidents as requests, or by applying workarounds instead of fixes — all of which look like improvement and cause repeat incidents. Read MTTR alongside reopen rate and repeat-incident count, or you will optimise the measurement instead of the service.
How many incidents do I need before MTTR means anything?
There is no strict threshold, but with fewer than about twenty incidents in a period a single outlier dominates the mean. At low volumes, report the median alongside it and quote the range rather than presenting one number as though it were stable.