
Product

Network Pulse Incident Operations Asset Lifecycle Engineer & SLA Inventory & Spares Operations Wallboard

Solutions

Manufacturing Healthcare Education Corporate & Multi-location IT

More

Pricing Blog Help Centre FAQ
Start Free Trial Book a Live Demo Sign in to your workspace

Help CenterVisibility and reporting

Use dashboards and reports to improve service

Use InfraCue dashboards and reports to improve ticket response, SLA health, workload and asset decisions.

Updated 26 Jul 2026

Dashboards give an immediate operational view; reports let you investigate a trend. Use both together to move from “what happened?” to “what needs to change?”
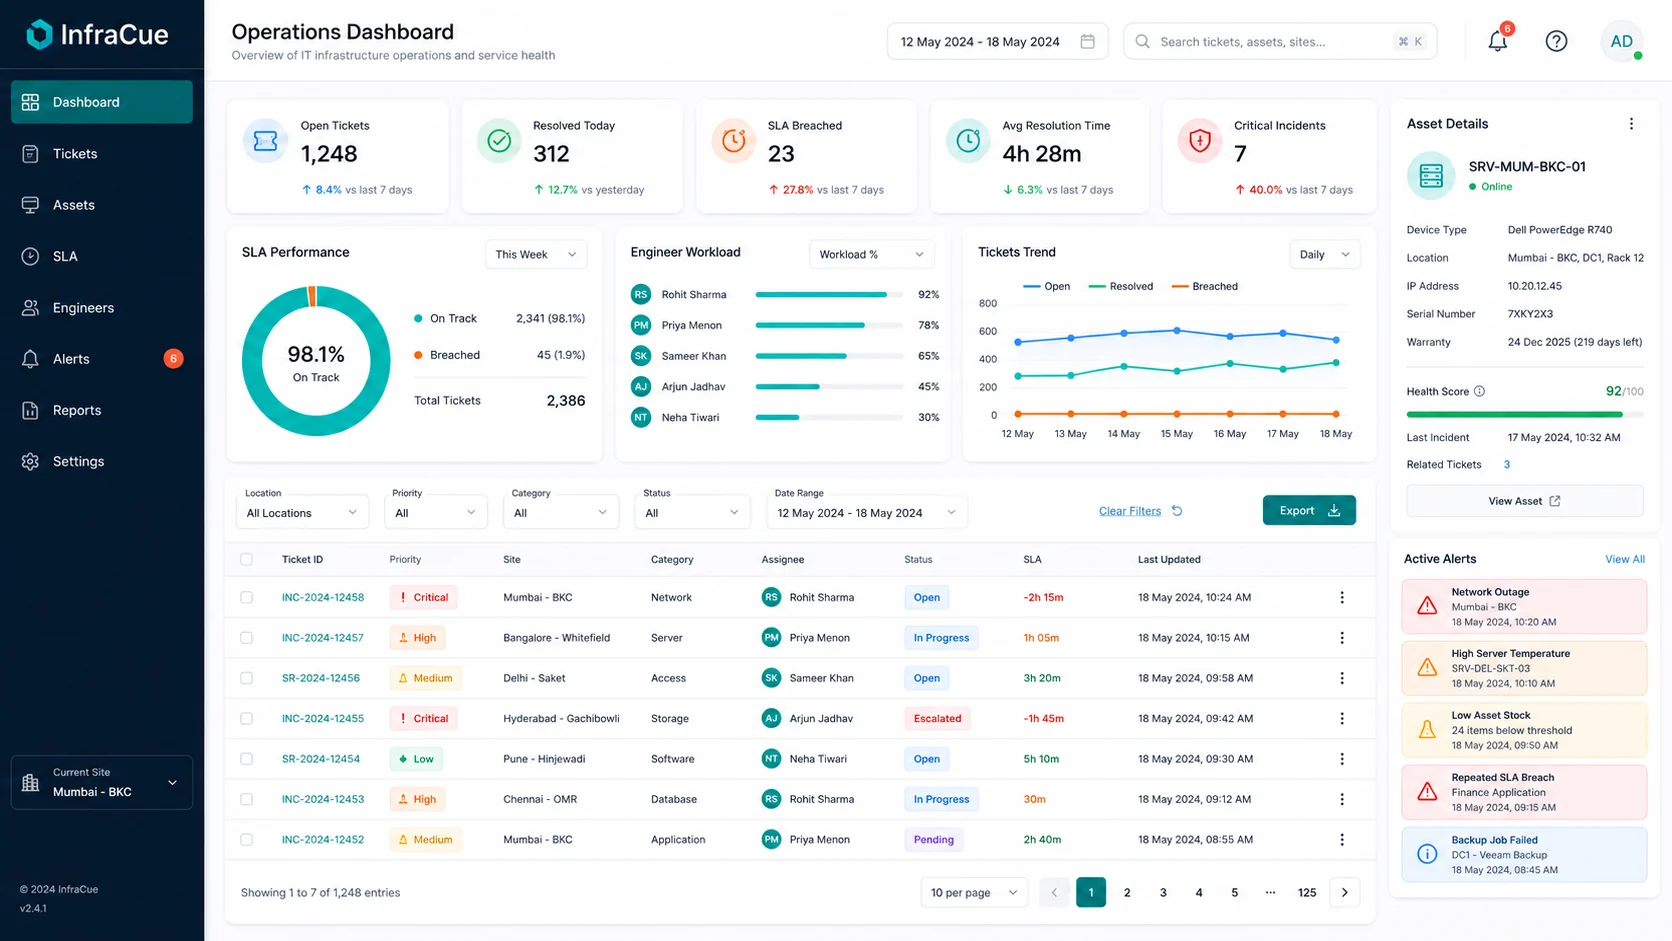
InfraCue operations dashboard with status mix, SLA health and engineer workload
Use the dashboard to spot pressure; use filters and reports to understand why it is happening.

Useful review questions

  • Which categories create the most requests?
  • Which locations or teams have repeated SLA risk?
  • Is workload balanced across available Infra Engineers?
  • Are specific assets or stock levels driving repeat support demand?